
Statistics
Our feature of the month is statistics – you can get an overview over your performance and check your consistency. This great feature makes is easy to learn more about how you handle goals, and also to be celebrate your successes.
In order to to get to the statistics view, simply click on the review symbol on the Goalify dashboard. It’s the one in the middle. On the review screen you’ll find all of your active goals listed alphabetically. The color of the goal icon depends on your performance – that way you quickly get an overview of which of your goals needs more attention. The color blue is used if your success rate for a goal is over 80%, orange if it’s over 50% and red is it’s under 50%. There you can see past success rates for all of your goals, and there’s also a graphic representation of the last 14 days/weeks along with a snapshot of your goal achievement for the period . This is very helpful if you want to know how things are going in general with your goals, and how you’ve been doing with getting done what you intended. Check the review from time to time – it’s the quickest way to get a handle on anything you might be falling behind on. Also keep in mind that an increase in missed goals does not always have to mean negative consequences. A good approach to goal analysis could involve the following:
- The level of your goal values: Have you set the mark too high?
- The frequency of your goals: Have you included enough breaks?
- Integration into your everyday life: How much do you have to change your routine in order to be able to work on your goals?
Of course it’s also important to find out how you’re doing with reaching your goals over a longer timeframe. To meet this need, users of the Unlimited Edition have access to an extended review. Here you’ll see a summary of all your successes, presented in the form of a bar chart. It’s such a great way to get an overview of what’s going on! You can find out when things were not going so well as well as when you were especially successful in reaching your goals. That way you get to know more about your potential so you can make better use of it!
Moreover, you’ll find your success rate that reflects your average rate of success over all your goals . The achievement number shows you how often you’ve worked on your goal. You can also see how for how many minutes you have worked on your goal, or how many kilometers you’ve run – what you see depends on how you’ve defined your goal. That really motivates you to stick with it!
Here you can see a great screenshot from a statistic of Michael who wants to avoid eating junk food: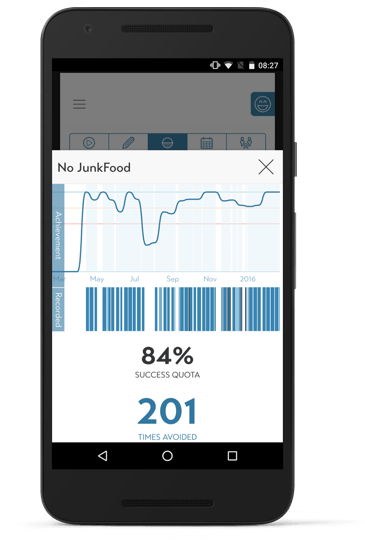
Now’s the time: Set up your goal, track it and then occasionally have a look at your status in order to see if everything is going according to plan.
Suitable for: data analysts, statistics experts, big achievers, nostalgia lovers, fitness enthusiasts, pro athletes, etc.